
Measuring the productivity of software engineering teams is a complex undertaking. For a start, productivity can be a subjective term. Even when benchmarks and metrics are set in place, how an engineer perceives productivity will likely differ from what an executive or board member sees. Everyone has different viewpoints, and each person’s interpretation of productivity will pass through their particular lens.
Productivity in software development is no exception. There is much more to it than simply the amount of code written and its bug-free state.
Metrics such as Deployment Frequency, Cycle Time, Pull Request Throughput, Code Activity, and Lead Time help bring some perspective, but a lot more work remains invisible.

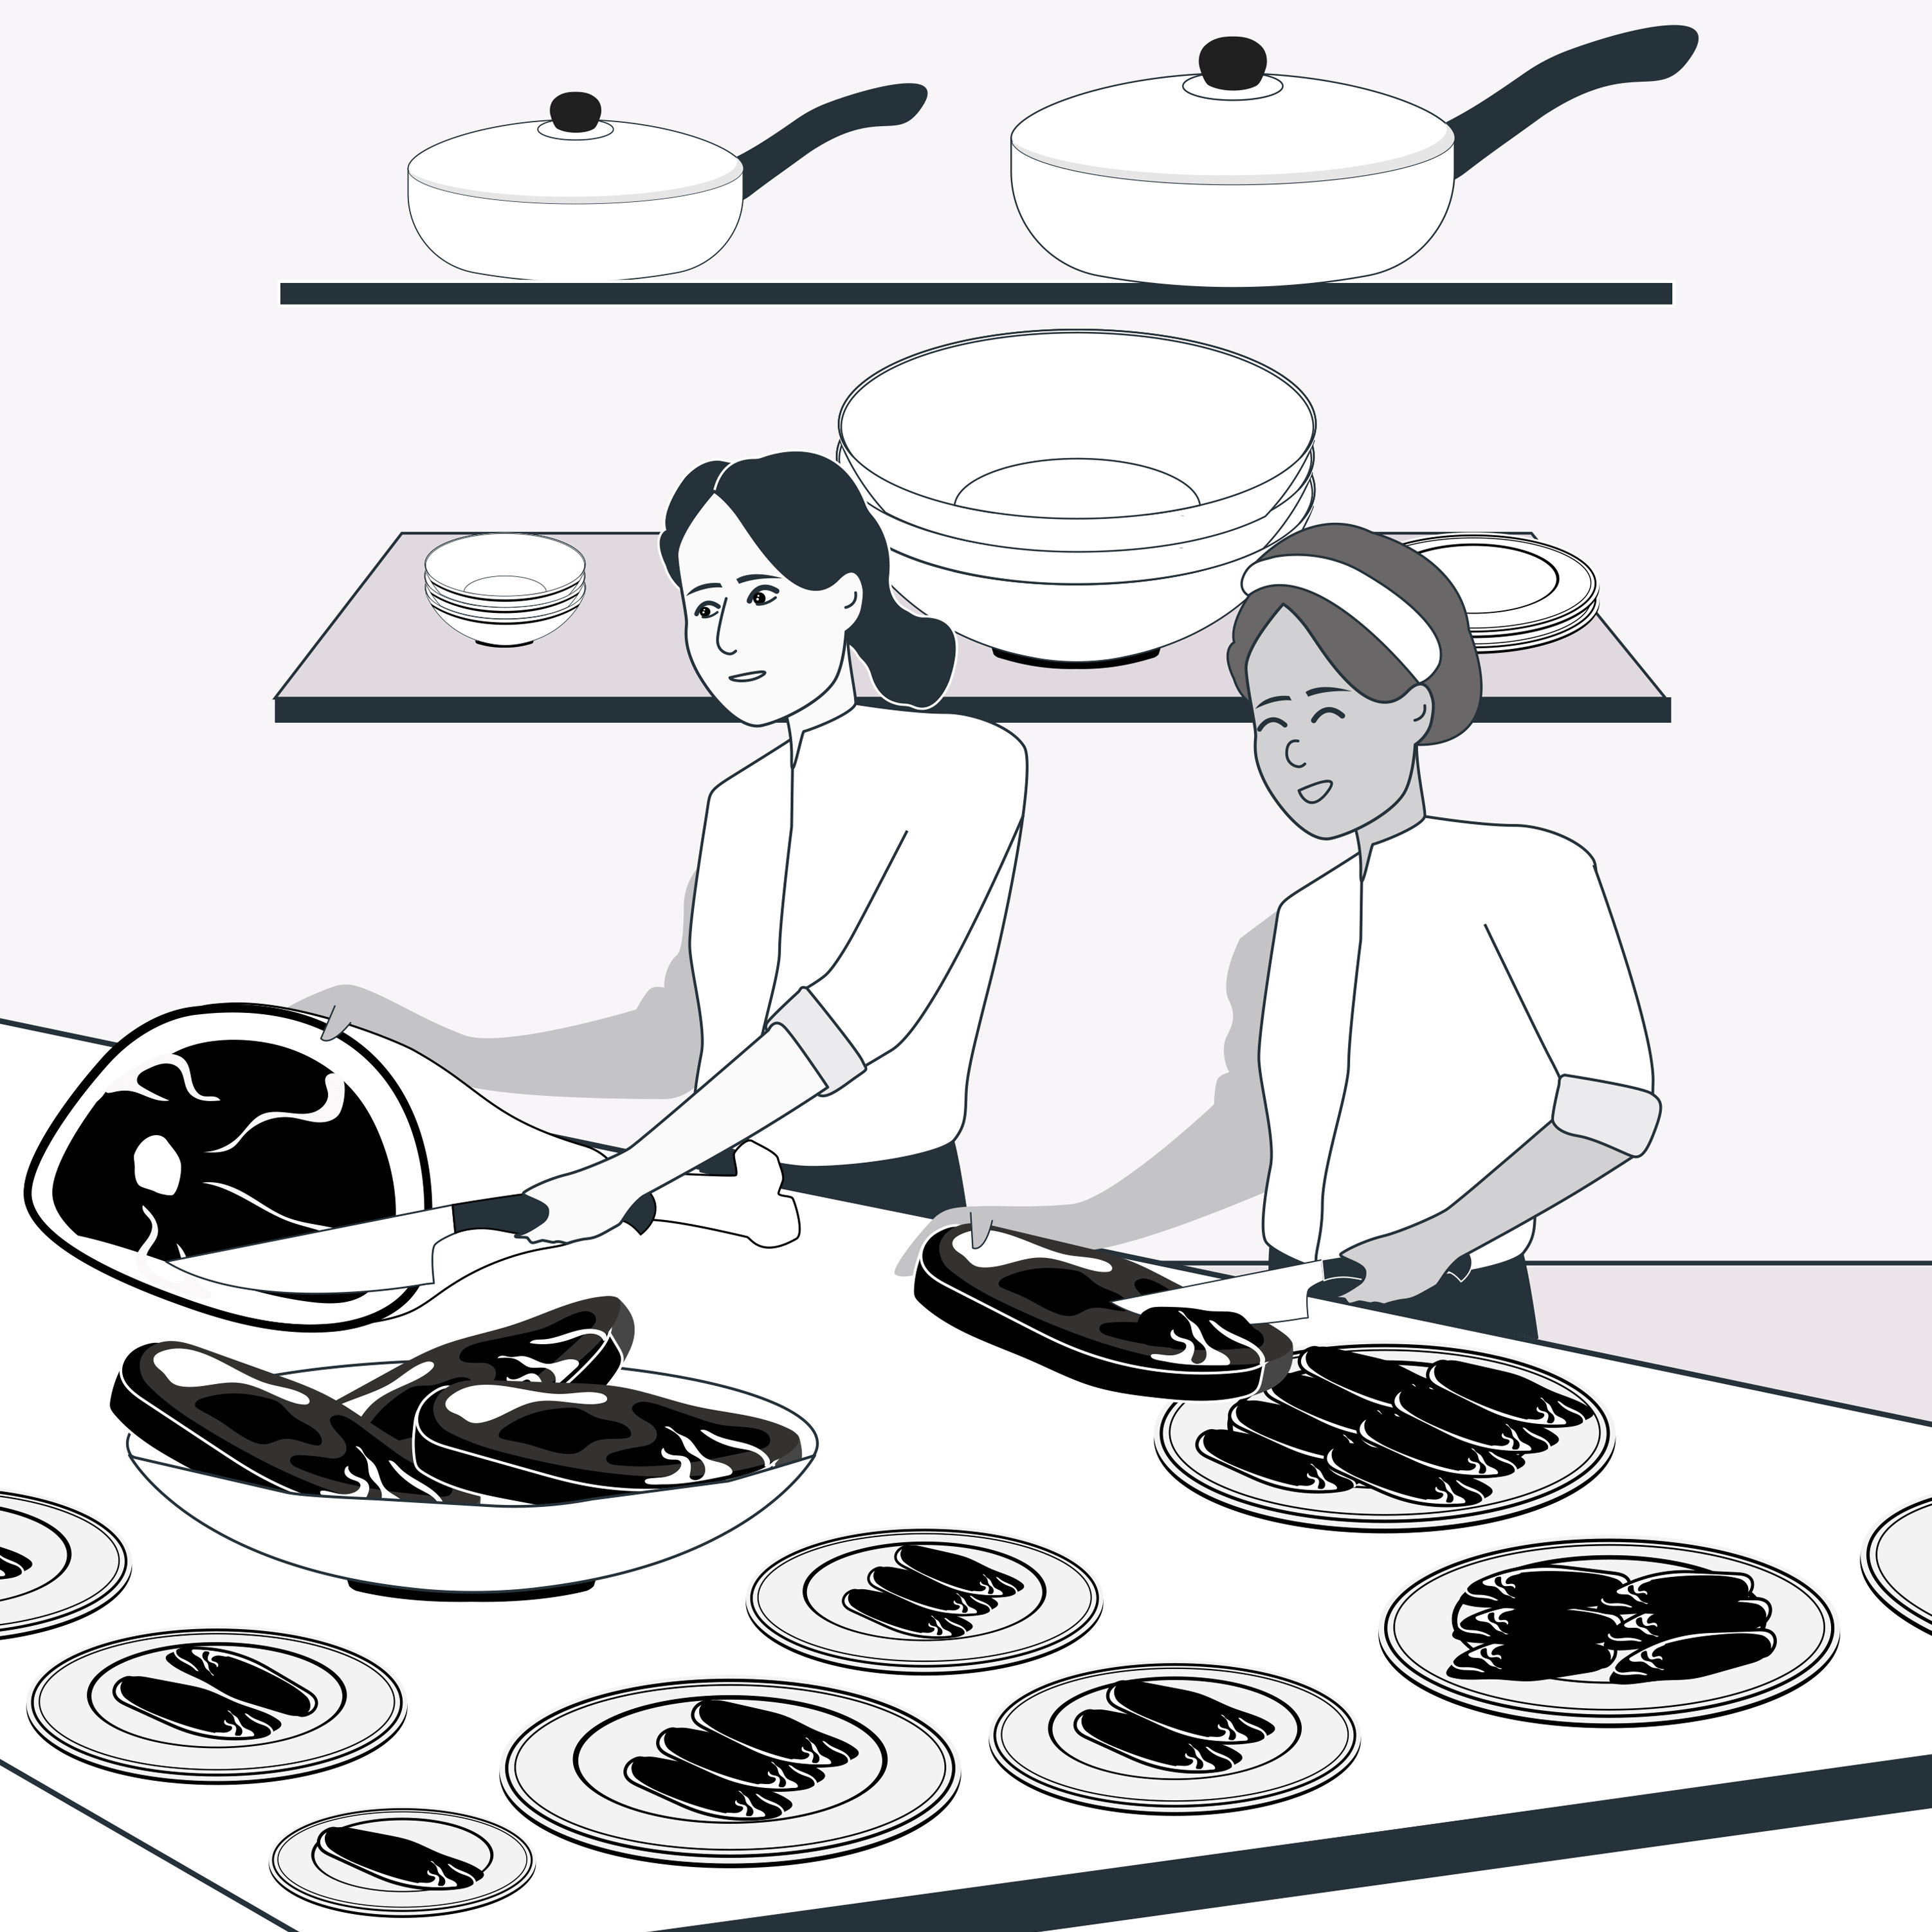
All work is valuable: there is a lot of work that needs to happen behind the scenes to make a successful restaurant; the same applies to when building software.
This invisible work increases the communications gap between the hidden, almost abstract world of coding on the one side and that of marketers, purchasers, and investors on the other. It’s a gap that can cause frustration and misunderstanding and can lead to employee turnover and a slowdown of business growth. It is usually the responsibility of engineering leaders to close this gap.
As I learned from my friend Peter Bell, founder and CTO of CTO Connection, there are two classes of metrics: efficiency and effectiveness. Efficiency ensures you are building things right. Effectiveness means you are building the right things. Productivity metrics fit under the efficiency umbrella, and most of the time, this generates an obsession with measuring solely code-related activities. Effectiveness relates more to business metrics and is usually aligned with a fiscal quarter's objectives, especially if you use the objectives and key results (OKR) methodology.
So, how do high-performance teams measure effectiveness?
This paper uses a simple restaurant metaphor to help readers understand that...
...when building software, every unit of work is valuable, and every job is essential.
It will explain why engineering productivity metrics should be widened to tell a complete and more accurate story. This understanding should help close the gap between engineering teams and stakeholders, proving to all sides that productivity and true value delivered goes beyond “just the code.” Delving deeper into the restaurant analogy, I have chosen to illustrate these metrics using the food delicacy carpaccio.
Similarly to the cupcake and scooter metaphors, the art of slicing carpaccio shares the same idea of delivering value incrementally.
Using metaphors like this is not that unconventional. People who analyze this industry will often use imagery that revolves around "slicing the work" properly, especially when building software.
I have seen cupcake, birthday cake, and wedding cake metaphors used in design thinking, and for building a successful Minimum Viable Product (MVP), author Henrik Kniberg explains in detail how to build a product into phases properly using a scooter, then a bicycle, then a motorcycle, and then a car. So, in that sense, carpaccio fits right in as a comfortable way for an audience to connect with the concept.
I like to refer to the "vertical slices," where each slice must be “delightful.” The whole idea is that you deliver value with each piece, whether it is a food delicacy or software. But it is not just about carpaccio as food. It’s also about the restaurant where it is served. It's essential to make the restaurant a profitable and sustainable business – that’s what every investor wants. This means the restaurant should “create” customers who are happy to pay for their meal and who will also return at a later date. To achieve this, there has to be a lot more going on than just actually seeing those dishes being served.
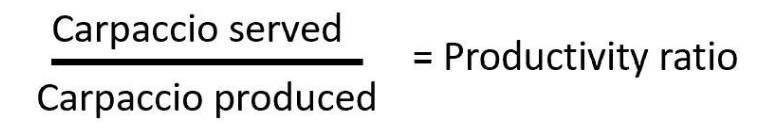
In this sense, I will use the action of preparing and serving carpaccio to analogize the essential productivity ratio:
But before we get to this, we first need to stop and spend a little time with DORA 4.
Accelerate and DORA 4
The book Accelerate by Nicole Forsgren, Ph.D., Jez Humble, and Gene Kim stands as a powerful and much-respected strategy for DevOps. It uses research to present and explain the industry metrics of maturity and productivity. Maturity in software development refers to the reliability of delivery, while productivity illustrates the pace of work. Code changes might be deployed frequently, as in hourly or on longer timescales of days, weeks, or months. As such, organizations can describe themselves in terms of maturity as low, medium, high, and elite. According to Forsgren, Humble, and Kim, elite maturity status belongs to organizations that deploy quality software multiple times daily.
At LawnStarter, for example, we deploy to production about 10-12 times a day. At Schoology, where I worked previously as Head of Engineering, the frequency was a little less, around three or four times a day, but with an engineering team three times bigger. In some of my older job experiences, we deployed anywhere between once every three months or once every twelve, with even larger investments. Achieving higher maturity levels is no longer the exclusive privilege of high-profile companies like Google; almost any company can achieve it, but it requires investments whose return is often tricky for executives or investors to visualize.
The work needed to improve the effectiveness of engineering teams is not cheap and takes time to pay off
...but it is just as crucial as any shiny new features that go out to end users.
Deployment frequency represents one-quarter of the DORA 4 collection of metrics, which together form a central component of the Accelerate book. DORA stands for DevOps Research and Assessment which was the name of the authors’ independent DevOps research group, acquired by Google in 2018. The other three DORA 4 metrics are: lead time for changes, mean time to recovery (MTTR), and change failure rate. Altogether, Accelerate and the DORA 4 metrics have been the preeminent driver of KPIs in the last few years.
We need a more human perspective
This deployment frequency approach places appropriately heavy emphasis on the act of changing the code. But I must ask myself, as a team leader, where's the human perspective? Metrics speak to people's performance, but they’ve been greatly depersonalized. In pursuing elite maturity status, we must ensure we are not just writing code for the sake of it. We need engineers who also understand the end user and the business.
We need engineers who also understand the end user and the business.
This observation about understanding the business must not be overlooked or minimized. It’s a human-focused thing. It also applies to collaboration, knowledge sharing, and team-building activities. Successful organizations build products that customers love, which can only happen when the right people are involved and treated correctly. Teams cannot afford to hire people who merely hit the keyboard to write code without any profound understanding of or connection to the end user.
Understanding the business means understanding its processes and goals and ensuring full team alignment with its North Star. Alignment with the North Star further requires an improved understanding of the different personas within the team and how they interact (this is something I explore in more detail in my book).
Now, let’s have some carpaccio
Carpaccio is an Italian appetizer consisting of paper-thin sliced meat, often served raw or rare. Part of its appeal comes from the thinness by which it is sliced. The increased surface area from its thinness helps maximize the taste sensation, making it a delicacy.
But carpaccio can also be used as a symbol of “value delivered" both in restaurants and by analogy, in software development. I’ll admit, I am a gourmand. I love to experience food, and I find great satisfaction in being able to translate life experiences like food and sailing (my other passion) into workplace learning experiences. I also love seeing teams develop, grow, and thrive through better, more modern techniques. Happily, carpaccio seems to fit the bill on all these priorities. Here’s what I mean.

A primary connection that combines carpaccio with delivering value in software is through this "user experience".
When teams rush to provide software, it parallels the rushed preparation of carpaccio, with the slices incorrectly cut, which will subsequently lessen its tactile, olfactory, and flavor experience. Occasionally, discerning dinner guests may return their plates to the kitchen if the carpaccio slices don’t meet the standard. In software, we call this unsatisfactory experience a defect or a bug. In both cases, in kitchens and coding, additional activity and expense must be incurred to correct the problem.
In the software development world, we find ourselves in an era of accelerated change, shorter timelines, and newer, more aggressive competitors. This means that any company that develops software must balance its investments in building new features with the costs of maintaining its existing products. Either way much must happen for teams to deliver value to users and to ensure a profitable, successful business.
High-performance teams must invest time in supporting other vital activities, which are vital while not being directly visible to users or critical stakeholders.
These can include:
- planning activities
- writing technical and non-technical documentation
- investigating code to learn its original intent
- building developer tools to increase the effectiveness of teams
- improving observability, scaling, and security items
- performing platform upgrades
- refactoring to improve maintainability
- or even touching anything in production that doesn’t leverage infra-as-code (IaC).
All the tasks that do not appear to directly result in new features and do not have direct revenue associated with them make the job of measuring the productivity of software teams more of a challenge.
For some organizations, this is still the way. Productivity metrics remain focused on the amount of code delivered or measurements around code activity. But these metrics tend to come up short. It is highly impractical, for example, to measure productivity using metrics such as the number of hours a person spends in their chair. Work just doesn’t happen that way, and the face time approach, which assumes a person is working hard just because they are visible, is inaccurate and unfair to both sides. Of course, this issue is further compounded by the growing trend of working from home.
Applications like Code Climate do an excellent job of measuring coding activities, but at the end of the day, much more needs to happen to understand something as subjective as producing value.
What's valuable when delivering software is a combination of many activities that go from having a great idea on one side to a happy customer willing to pay for the product on the other. In between, you have humans who need to work wisely together to build a successful business.
The concept of carpaccio and its role as a success factor in the software business, or in running a restaurant, illustrates three key vital components:
- The work needed to create the product;
- Delivery to the customer; and
- The importance of having delighted customers who are willing to pay for it.
These can all be used to analogize more efficient DevOps.
Imagine a typical company that has assembled a small group of people, one from product, a few from engineering, and one from design. This small group of people represents software development's three disciplines, which I refer to in my book as an iron triangle. Now imagine they are in the kitchen of a busy restaurant, world-famous for its antipasto dishes, including carpaccio. It would be expected that these three people will focus a great deal on the finished product.
The person from design will consider its final appearance – its presentation laid out on the plate and served to the customer since this will go a long way toward the customer’s enjoyment. The product person will likely want to know if the restaurant is preparing the “right” things and will also want to explore opportunities to increase the number of carpaccio dishes sold without compromising quality. This is vital to increase profits without minimizing the user experience. The engineer will look at how best to prepare and deliver most efficiently.
So, it’s not too much of a stretch to see how well-defined processes are necessary in a kitchen as well as in a software development environment. Without it, people will be stepping on each other's toes, and customers and the business will suffer. In the case of carpaccio, if there is no properly sharpened knife or slicer available, the product will go out too thickly or will be inconsistently sliced. When that happens in software development, that’s a bug, and this will increase the Change Failure Rate (one of the DORA metrics) or, as I like to call it, the Carpaccio Defect Rate.
But even that’s not good enough. The system must work better than that to create value and maintain a sustainable business. In software development, there was a time when it was acceptable for bugs to exist when code was pushed into production and made available to users. But now, consumers will likely abandon the product immediately and permanently if that happens. Tolerance levels are much lower these days. In a restaurant, a dissatisfied customer might never return, and worse, they may leave negative reviews on social media, especially if they are passionate about exceptional carpaccio.
The challenge of getting it all to the customer
But there is more to good food than simply the quality of the ingredients and the preparation technique. A significant part of the success of a popular restaurant comes from its physical delivery to the table. When dining together in a restaurant, guests expect that everyone at the table receives their meals from the wait staff at precisely the same time, and every meal should be at its ideal temperature. No one likes being the only person at a table whose food hasn’t arrived. This is an unstated element of the dining experience, not printed on any menu. It is one of those supporting yet not directly visible components that support the quality of the product. It requires a delivery method that is separate from the “production of the food” process yet integral to it. It is the essence of efficient restaurant management.
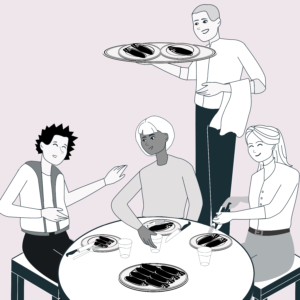
Serving food to the table can be comparable to delivering code to the production environment.
The main idea behind CI/CD is to push code out more frequently, delivering value with smaller risks. But sometimes, that is not a trivial activity, nor is it even possible if continuous investment is not added to the agenda. Depending on the application's architecture – monolith, microservices, or serverless – and how teams are organized, multiple teams may contribute to the same code base, leading to a release coordination nightmare that prevents code from being released in the cadence needed. From a restaurant perspective, this is like using a single server to bring the food from the kitchen to the guests. The waiting time will be longer than customers are willing to accept.
In an ideal world, each application can be released multiple times a day whenever the code is ready for final users. In a restaurant, food should be served whenever all dishes for a table are ready to be served. Even in Accelerate, the authors talk about the need for teams to be self-sufficient and empowered, which implies fast code delivery.
But code comes with dependencies. Applications intertwine, meaning releasing one without breaking a connection elsewhere is seldom possible. Engineering teams may try to create robust APIs, sophisticated testing strategies, defensive coding, etc., all in an attempt to make each software component as independent as possible.
In the ideal world, each team would own its software from the bottom-up
...but in reality, there will always be dependence and complexity involved. This means that sooner or later teams have to coordinate to contribute to the same code base and manage code releases.
The reality is that shipping code takes time, and the process has limitations. At LawnStarter, it takes about 30 to 40 minutes to push our main API to production. Every time Team A and Team B want to release changes to the API, they may have their code shipped together. When both changes go well, that’s great. A happy customer means a happy business. But when one of them doesn’t go well, both code changes must go back to the kitchen, even though only one was defective. They are tied together, and that comes with a cost.
So, using the restaurant kitchen analogy again, it’s like a waiter telling the kitchen what is needed for a table with two differently styled carpaccio orders. For the chef, this means two carpaccio orders in one shipment. That shipment will add another digit to the deployment frequency metric. The ultimate value to the restaurant will be the successful delivery of the two different carpaccio orders on time and correctly. The problem is,
...when things go wrong with one plate, the server then must bring all the plates back to the kitchen even though only one of them wasn’t to the customer’s taste.
That impacts the overall deliverables, customer satisfaction, the restaurant’s profits for the night, and possibly its reputation.
Slices of carpaccio in software development
To understand the levels of care that go into software development, I suggest product and engineering teams use the following approach when slicing the work, inspired by Atlassian, where each is a subset of the one before:
Rock->
Initiative-
>Epic
->Stories
-> Bugs
->Tasks
In the carpaccio analogy, you can think of stories and bugs as the most granular individual piece of carpaccio. A story is a new, sliced-to-perfection piece of carpaccio that should be delightful to a customer.
A Story should not be so big that preparing it would take much longer than customers would be willing to wait for, or so big that customers would not enjoy eating it. A story should also not be so small that customers wouldn’t even notice that it has been served to them (like a garnish), thus being unwilling to pay for it. In my teams, I like to set a goal that stories can’t take more than five days from when the work starts to when it is delivered to customers. If it needs more time, then it needs to be sliced further.
A Bug happens when we deliver a piece of carpaccio that doesn't meet expectations and gets returned to the kitchen. As stated in the previous section, sometimes, dinner guests may send their plates back to the kitchen because the carpaccio slice didn’t meet the standards. Additional activity and expense will be incurred in both cases to correct the problem.
Correcting bugs is essential to any sustainable business, and fixes should not be accounted for as new pieces of carpaccio, in just the same way customer in a restaurant wouldn’t pay twice for an unsatisfactory dish that was sent back to the kitchen and replaced.
Tasks are composed of all activities required to produce the carpaccio. Tasks don’t represent the product being directly delivered to customers but are essential for carpaccio preparation in the kitchen. Tasks such as sharpening the knives and cleaning the cooking stations are good examples of equally essential contributors to the end result. As mentioned before, in software, these include valuable activities such as planning, writing documentation, performing investigation spikes, etc.
Epics are like serving plates full of carpaccio. When we combine multiple plates, we have an initiative with enough carpaccio to serve one or more full tables. Multiple initiatives would comprise the entire Rock, representing enough carpaccio to serve everyone at the party. A Rock would be when we have delivered enough initiatives towards a goal enough to contribute revenue to grow the business.
In the real world of software development and now described in the reverse order, a Rock is a measurable company objective that is reviewed quarterly, and which can span across multiple quarters. It is a high-level area of focus that can cross various teams and departments, which ultimately helps tell the story of how they are building towards the company vision. A Rock is composed of many Initiatives.
An Initiative is a time-bound body of work that advances toward a defined goal for the company’s Rock. It produces quantifiable business value and presents meaningful solutions to the user as a project. Every Initiative must include a goal statement and answer the following questions:
- What is the goal?
- What problem are we solving, and why do it now?
- How are we measuring success?
An Initiative is further composed of a group of Epics, Stories, Tasks, and Subtasks. All work shipped must be part of an Initiative unless it is extraneous to its quality, such as a long-standing bug.
An Epic is a milestone within the larger Initiative and represents a cohesive set of Stories (sometimes it also includes bugs) that achieve the stated goals. Epics must have a clear beginning and planned end. In addition, Epics must have a defined purpose/scope representing a milestone/release. An epic bridges individually shippable user stories to the larger initiative by grouping a set of stories with similar use or business value. Epics must represent vertical slices of work that deliver end-to-end value.
Stories, Bugs, and Tasks are the small increments (five days or less) of work that are needed to complete an Epic.
The Carpaccio productivity ratio
I have been using deployment frequency and DORA 4 metrics as critical guides for many years in my career. Still, I have struggled to demonstrate productivity, mainly because of the "invisible work that happens in the kitchen." That’s why I eventually landed upon the productivity ratio mentioned earlier as an ideal way of explaining productivity. Once again, the formula reads like this:
ROI highly depends on the Productivity Ratio. For instance:
- When the Productivity ratio = 0%, a lot is happening in the kitchen, but no carpaccio is being served. Therefore, the restaurant can't be sustainable.
When the Productivity ratio = 100%, all the kitchen work directly results in carpaccio being served to customers. This is a utopia and impossible, in my opinion.
The optimal numbers, in my experience and using data from my teams, are:
- Productivity Ratio < 70%: Teams need to focus more on delivering carpaccio to guests.
- Productivity Ratio >= 70% and <= 85%: Good balance on keeping the kitchen in shape while delivering carpaccio.
- Productivity Ratio > 85%: Opportunity to invest in activities that can promote better knowledge sharing, stronger collaboration, user experience improvements, process enhancements, etc. Anything that could make the kitchen more efficient overall or activities to help scale the business.
The following illustration is intended to represent known industry metrics, and how the new A) Carpaccio Served and C) Carpaccio Production connect with them:
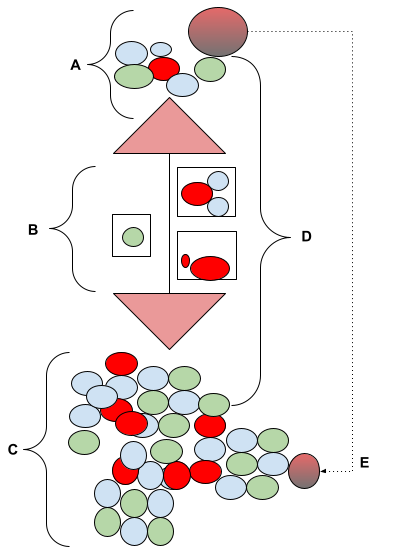
A) Carpaccio served: All the carpaccio that gets served to customers. The result is direct revenue to the business.
B) Carpaccio Frequency: The rate at which carpaccios are being served, whether delivered individually or grouped. The software industry calls this “Deployment Frequency.”
C) Carpaccio Production: All the work required to produce the carpaccio. This includes sharpening the knives, cleaning plates, organizing the kitchen as well as cutting the carpaccio itself.
D) Carpaccio Production Time: The amount of time it takes between the carpaccio being cut and prepared until it gets served to a customer. The software industry calls this “Cycle Time.“
E) Defective Carpaccio Rate = Defective carpaccio / Carpaccio Served. The software industry calls this “Change Failure Rate.”
F) Carpaccio Lead Time (Not represented in the picture): The amount of time it takes from when the customer places an order to when the carpaccio arrives at the table. The software industry calls this “Lead Time for Change.“
Factoring in a strategic debt
When planned correctly, the notion of debt might also factor in as a positive and balanced contributor to the productivity ratio. On the one hand, a decision to borrow from the future allows you to get something achieved sooner, but on the other hand, when you take on too much debt, you place a limit on your productivity because of the amount of interest that has to be paid. In a restaurant scenario on a busy Saturday, you might decide not to tie up staff with washing all the dishes, thus freeing them up to ensure they can do their part in serving customers promptly (increasing your productivity ratio). But if you don't wash all your dishes before the next busy day, you won't be able to serve all your customers (thus, a lower productivity ratio). Now, back to ROI.

Investors always want to see a sustainable and profitable business.
Suppose they invest $1 million to add more people, buy new and better machinery, or introduce new technology. In that case, they expect $1 million + x multiplier in y amount of time. In the restaurant, if no carpaccio is served, no customers are paying, which means the business is not sustainable. If the restaurant hits the 100% Productivity Ratio, it can do great in the short term, but will not be sustainable. Plates will be dirty, knives won't be sharp, and people will be stepping on each other due to under-optimized processes. An optimal and realistic productivity ratio would be between 70% and 85%.
As already stated, investors want the customers to enjoy their dining experience and then make reservations for a return visit. The more their patronage recurs, the more it becomes predictable. In business terms, stakeholders want every customer to represent healthy and wealthy ARR (Annual Recurring Revenue). This is the essence of the subscription model, used in online apps but which is not so obvious in the management of high-end restaurants. It is, however, seen in the loyalty card model used by large chains like Starbucks, for whom the carpaccio model is equally applicable to their products, service, and productivity ratio.
Seeing the challenge from a leadership perspective
I tested out the carpaccio analogy on the ultimate audience – the executive team at my current company. They already knew that relying solely on looking at code metrics was inadequate. Those metrics were not explaining the whole story.
Executive members had questions like, “why are we investing X million dollars in adding more people to the engineering team when the deployment frequency is not improving proportionally?”
I knew this was a fair question. Even though our teams were working extremely hard, improvement was not visible. My executive peers had the right to ask me to explain the ROI as we were scaling the team. Going back to the carpaccio/restaurant kitchen analogy, my answer was, “it is a fact that we added more people to the team, that we are producing more and that we are having more units of work being delivered. But this means the servers are being given more plates full of meals, and that’s where the bottleneck happens. The kitchen is busy, but there is only so much that servers can handle!”
This was an image that made sense to them. The executive members showed signs that they were starting to get it. But they wanted to know more about how to serve more carpaccio to the guests to increase profits and also how to measure this. “OK, we’re making great carpaccio,” they said, “but how do we know whether we are spending too much on sharpening knives? How will we know if we have more knives than we need? How do we find the right balance between all the work that we put into producing carpaccio versus serving it to customers?"
This is where I sought to distinguish the metrics in their minds:
- The primary metric, I said, was the total amount of carpaccio served, the Carpaccio Served metric. That is the number that will bring the profits to the restaurant.
- The counterbalance metric is all the work needed to produce the carpaccio itself, the Carpaccio Production metric.
- The actual productivity metric needed to help understand the ROI comes from the ratio of the amount served divided by the amount produced, as I explained earlier.
- Carpaccio frequency remains a valid metric to measure maturity and help teams understand the improvements that need to be made to accelerate the process of getting carpaccio to the table.
Still, it does not necessarily tell the story of all the great work that employees are doing in the restaurant.
Without understanding the productivity formula, the risks appear:
- We risk having too much carpaccio, most of which will not make it to customers’ plates.
- We risk working too much on internal kitchen activities that wouldn’t necessarily produce enough carpaccio to be served.
- We risk not being able to serve the carpaccio as and when it becomes available to be served.
When teams work on a one-to-one relationship, producing individual carpaccio servings on demand, that's also a problem because then teams will not be able to get to the most effective way of working in a kitchen. The bottom line is that scaling is not an easy task but is required for any company that wants to see its revenue grow.
Every CTO or engineering leader deals with the same challenge: “how much value are we getting from product engineering?". This is especially so, given that it is always the most expensive department in any SaaS company. For this, the metrics that matter show value across everything done in the department.
Conclusion
The industry needs a better way to measure software engineering productivity. The current industry metrics don't tell a true story and are obsessed with looking only from the code perspective. It is my hope that the Productivity Ratio metric, as presented in this paper, will help Engineering leaders close the gap in communicating a team's performance, allowing those teams to focus on activities that will move the business forward.