
A practical guide for measuring the productivity of software teams.
Engineering and Product leaders are constantly expected to balance innovation, quality, and profitability. Such a requirement becomes a challenge that can lead to clashing priorities and perspectives within any organization. I realize that my own experiences as a seasoned CTO have created some fertile ground from which ideas and improvements in this area have now made themselves visible. I have spent a good deal of time over the past few years consolidating and testing these ideas and then putting them out there for my colleagues and peers to hear, and thankfully, the response has been overwhelmingly positive. This paper offers a deeper dive into a concept of mine that has already been recognized for its transformative potential, one that I call the Carpaccio Model, and which was introduced in a paper I published in 2022. Building on the analogy of meticulously crafted carpaccio in a restaurant, the model invites you to explore the concept of software development as a multifaceted gourmet process that goes beyond just writing code.
Allow me to explain: in my earlier paper, Engineering productivity goes beyond “just code”, I drew an analogy between a software business and a restaurant, and I used the delicacy called carpaccio as the centerpiece. Carpaccio is a savory antipasto dish consisting of very thinly sliced meat. Its preparation calls for careful planning, quality control, and delivery - exactly like work units of software development. The article resonated strongly, and I have since given my “carpaccio talk” to companies and teams all over the world. Upon hearing it for the first time, people in my audience told me that they could see how this approach could have truly transformational effects on their own SaaS companies.
Whereas that first paper described the “what,” the one you are reading now delves into the “how” and the “why.” Its intent is to show how you can apply the carpaccio concept to your own organization, and the compelling reasons for doing so.
So why a metaphor? Because it stands as a friendly reminder of all the work that must happen in the creation of the end product, but which isn't always visible. To build and deliver software products, there are code and non-code activities. Every segment must be perfect and delightful to the end customer. For food, this means taste, texture, and quality. For code, it means reliability, security, and ease of use.
This all may sound obvious, but people seldom think about all the hidden work required. In a restaurant, this includes the people who sharpen the knives and who wash the dishes. It’s work that seems far removed from the experience of eating carpaccio. Yet, without sharp knives, the carpaccio as a dish will be substandard. Without clean plates, the customer experience will be decidedly negative. In software, this invisible work includes:
- writing documentation
- performing upgrades
- working on security patches
- investigating the code intent of an existing functionality
…among many other examples. Without proper investment in the hidden work, the customer experience here will also be decidedly negative. Unhappy users disengage and ultimately impact the sustainability of the business.
Engineering leaders such as CTOs or Engineering Managers often find themselves wedged between two groups. On the one side stands the C-level leadership of the company, made up of executive teams and investors. These are the people who naturally want the business to move forward and be profitable. On the other side are all the software teams who must do the work to make this happen.
In my experience, this inevitably causes a clash of priorities and perspectives. The desire to advance the company while managing costs is a priority for the executive side. At the same time, engineers and their managers strive to balance quality and maintainability with innovation. In addition, work is seldom consistent in terms of the ebb and flow of the marketplace. This makes the decision to embrace a new process even more difficult.
For example, in a restaurant, what happens on those busy Saturday nights when every table is fully occupied with guests and all staff members are needed on the floor? Is it acceptable to not wash all the dishes or sharpen all the knives during this peak period? This is a situation that I call strategic debt, and it happens in SaaS companies in a very similar way.
Rallying your team together might allow you to serve more carpaccio and bring that full experience out but, when is the right moment to invest more or less in the required and invisible work? It’s a decision that needs more than gut feeling to make. It also needs data, and that’s what this paper is about.
Go climb a rock
Connecting the dots between the carpaccio performance metric and individual contributions only becomes possible if expectations are aligned. The company's North Star - otherwise referred to as a rock - has to be clearly understood. For sure, it is common to hear people talking about OKRs and KPIs, but how often are they translated to each individual contributor across multiple software teams? How do people know how their contributions add up to their team or company goals?
In my consultancy work, I repeatedly see gaps between what upper management expects and what software teams can or should deliver. To address these challenges, let me use the direct example of my current company, and how we established our own software development team metrics.
I'm the Head of Engineering at LawnStarter, a marketplace for outdoor home services. Our platform connects consumers with trusted pros to get the job done right and on time. Just like in a restaurant, behind all those tidy jobs there’s a great deal of software and logistics required. And that’s where my team and I come in.

At LawnStarter, we use the "sign-up to completion ratio" (SCR) as our core metric
The image above focuses on what we call SCR, which stands for sign-up to completion ratio. First, it shows the percentage of customers who have signed up for our lawncare services. Then, it shows how many of these have had their first job visit from us. For a more well-known example, think about all the people who have signed up for a service like Uber, versus how many have actually taken their first ride.
In this example, our company rock is to help customers get their first mow done on time. Using recent data, this image shows that one of our company objectives is to achieve 65% SCR for 2023 and 70% in 2024.
- Each team will also have its own rock. But it is not unusual to have multiple teams working together propelling one single rock.
- In addition, teams will also have their own carpaccio goals, which are based on the team formation, its size, and the different levels of expertise within it.
- It is key that each person on the team understands the rock they are contributing to. For every slice of carpaccio produced, that should represent one step closer to achieving the rock.
Let's continue with the table above. A year earlier, in August 2022, we experienced a 60% SCR, and so for 2023, we aimed for 65% for the same period of the year, meaning 65% of the customers who sign up will have received their mowing service. We have thousands of providers and tens of thousands of customers, and we intend to keep growing both groups.
The success of this rock comes from ensuring we maximize the number of customers getting the job done in their houses. For that to happen, we need to be laser-focused on investing our engineering capacity in the right initiatives. That's where key results #1, #2, and #3 above come from for this particular quarter. The key results will change quarter over quarter, as will the expectations for carpaccio produced.
In the background, we have multiple software teams maintaining and growing the platform. As with any other leader, I need to know how the team members will be performing. In the context of the team shown in the picture above, in particular, it is expected they will produce the equivalent of 250 items, or 250 carpaccios (Key result #4). These 250 pieces of carpaccio should be enough to complete each one of the key results assigned to the team within the quarter.
Carpaccio goals are based on team formation, size, and the different levels of expertise within a given team. A smaller, more junior team is expected to produce 230 carpaccios. Larger teams with experienced members should be able to produce 280 delightful pieces.
Of course, we expect some defects because we're all human, and things can go wrong. In fact, I strongly believe in the concept of creating a work environment where people can make mistakes. Making mistakes is the most natural way for a human to learn. I like to say that making mistakes is okay; making the same mistake more than once is not okay. Naturally, I have a process in my teams to learn from each mistake so we can continually learn and improve. At LawnStarter, our definition of excellence is to have less than 5% defects (key result #5) for every carpaccio we produce.
I will talk about the productivity ratio more in-depth later in this article. For now, keep in mind that I found the sweet spot for my teams, having it between 75% and 85% (key result #6). In practice, this means 75 to 85 percent of all the work my teams produce ends up in the production environment. The remaining 25 to 15 percent accounts for equally important work that is not necessarily visible to users, management, or investors. That's what I referred to as the invisible work in the previous section.
How do I track carpaccio produced?
I use a simple spreadsheet (not custom software), that lists engineers from each team by their relative title and seniority, e.g., associate engineer, software engineer, all the way up to lead engineer. Each of these levels has an expected number of tickets (or carpaccio) as their goal per quarter. The average cycle time from in progress to done is expected to take two to five days. If a ticket is estimated to take more than five days, it must be broken down further. That's the premise for the system to work.

A simple spreadsheet can allow managers to monitor done vs. planned
Therefore, four people with the title of software engineer will be expected to deliver 4 x 50, or 200 carpaccios in a quarter. You should know that this data is linked to a second tab that tracks each engineer individually. It gives each an awareness of where they stand in relation to the entire team.
I also live and believe in a culture of complete transparency among all team members. So, if you are asking yourself, is this data shared with every single engineer? The answer is absolutely yes. We are all in the same boat, and it is expected that every single person will contribute in accordance with the posted expectations (or higher). It's a great exercise in maturity and trust, and the only way we will be able to achieve our rocks. Having one person on the boat who is not performing accordingly can and will impact the ability of the whole team to succeed. It is just a matter of time before things start to go wrong when not addressed. For that reason, full transparency is a must when building high-performance teams.
You can access and download the template Carpaccio Metrics spreadsheet for a better understanding of how the logic works. You will find one configuration tab, one tab for each team member (I used superheros' names for this sample), and one summary aggregation tab. You may want to use this template to get started on applying the methodology to your team.
I can imagine some readers of this paper interpreting my worker analysis as some sort of Industrial Revolution-era work-tracking device. But the goal is not to penalize individuals: in fact, it is the opposite. Millions of people have been fired over the decades because of management’s bias that workers were underqualified, or simply not working well enough. As a result, they were considered to be an “excess cost” and consequently made redundant. The truth is the reason for poor results is often buried within the process itself.
By tracking the production of each carpaccio, we are able to identify areas where there is a need for improvement. For example, let's consider a team member spending more than a week investigating an area of the code when such a procedure should not have taken more than two days. By gaining such visibility, the manager can track progress and provide proper guidance for those who need help. Remember each team member has the visibility of what's expected of them based on their level of experience. This kind of tool points out whether they are falling behind, and allows team members to be proactive in finding blockers and identifying solutions. It is expected they enter the reason why they were not able to meet their weekly goals. That reason is an awesome topic to discuss during the next one-on-one meeting between the manager and the individual contributor.
This is not a model for punishment, but instead, it is a platform for continuous improvement. It is based on efficiency models that were established in movements such as the Toyota Production System in the 1960’s and then the Agile Manifesto in 2001. It is never about retribution – it is about having the whole crew on a boat being able to work together toward a common goal.
The key benefit for everyone with a model like this is that you can also aggregate the data to see the bigger picture. If someone hasn't met their individual quota for the quarter, other team members can work as a team to pick up the slack and achieve the team’s goals. If a disproportionate number of people appear to be struggling, it might be a management issue, or it could be process-related. The important thing is that the aggregate score for the team should meet the expectations required to achieve the rock, and that is what the executives and investors like to see.

The chart shows actual delivered, original goal, and adjusted goal for carpaccio delivery over time
A simple line chart summary like the one above reveals to the stakeholders that collective progress is being made.
- The red line represents the goal that we committed to as a team for the quarter.
- The blue line is the actual delivery. So, in this quarter, the team quickly rose above the actual goal. The team is producing a lot more than was expected.
- The yellow line represents the adjusted goal. This line is impacted by our culture.
Further to my boat analogy, the culture on board is vital to the success of the crew. No ship or corporate team will do well if the crew members feel unappreciated and worked to death. A team needs members who are happy, motivated, who feel respected, and who understand the business.
Let’s take parental leave as an example. When one of our employees takes this type of leave, we know we can no longer expect the same number of carpaccios to be produced in a team. So, our yellow line adjusts. As a leader, if I see that there is too much space between the red line (committed goal) and the yellow line (adjusted goal), it means we will need to make some adjustments to narrow that gap.
The great thing about this is that when the yellow line (adjusted goal) is compared to the blue line (actual delivery), it becomes easy to see when the team is delivering above or below expectations and take action accordingly.
The implementation of the Carpaccio theory to measure the productivity of software teams
Now, let’s look more closely at how this works in the world of software. What I am putting forth here is not a replacement of DORA 4 metrics, but an evolution of its concepts. When the DORA 4 metrics are used to measure software development team performance, they provide great insights -, but they still leave some blank spots. So let’s look at this first from the carpaccio standpoint.

In practice, this is what Carpaccio Restaurant Processes would look like - and thus, the origin of our SaaS team productivity metrics
You will see the DORA 4 metrics showing up within the carpaccio production process as
- Carpaccio produced: All the work required to produce the carpaccio. This includes sharpening the knives, cleaning plates, organizing the kitchen as well as cutting and preparing the carpaccio itself.
- Carpaccio served: All the carpaccio that gets served to customers. This results in direct revenue for the business.
- Carpaccio frequency: The rate at which carpaccio dishes are being served to customers, whether delivered individually or grouped. The software industry calls this deployment frequency.
- Carpaccio lead time: The amount of time it takes from when the customer places an order to when the carpaccio arrives at the table. The software industry calls this lead time for change.
- Carpaccio defect rate: This is calculated as defective carpaccio divided by carpaccio served. The software industry calls this change failure rate.
- Carpaccio production time: The amount of time it takes between the carpaccio being cut and prepared until it gets served to a customer. The software industry calls this cycle time.
The two new metrics or variables I want to bring to the table are the first two on this list: carpaccio served and carpaccio produced. They reflect how much work my software teams are doing and how much of this work ends up in our customers’ hands, leading to direct revenue. In both cases, carpaccio and software, it remains important to know how often you are going to serve the product (deployment frequency) but that does not paint the whole picture.
How to capture and use these new metrics
It can be challenging – and can devour significant resources and time – to capture everything that's produced in a software team. Even more so when its members use different languages, frameworks, and procedures. That’s, unfortunately, a natural and necessary part of the work. Just like the staff of the restaurant, each person needs to be empowered to align with their company’s north star in a way that matches their work.
The paradox becomes how to find a way to measure productivity across all these different autonomous team members. We need a single common denominator. For me, this denominator is “how the teams are producing the value,” whether it is code or not, and it looks like this:
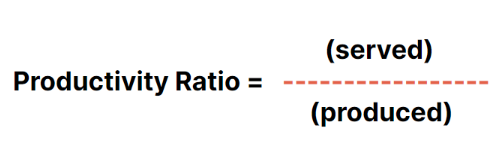
The Carpaccio Method focuses on Productivity Ratio, aka Served / Produced
This is the essence of my job as an engineering leader, and therefore the essence of this paper. To make this simple formula work, I track every single activity that these teams do, right down to an individual, per employee level. This has become much easier today than it ever was in previous decades, with the availability of project management tools. Regardless of which one you use, the denominator in this formula remains the same: the amount of work being produced. I use JIRA, and consequently, its different issue types – task, story, bugs, and so on.
Tasks become the place where the invisible work can be categorized and documented.
Stories and bugs are the only ticket types that allow changes in the production environment.
The Carpaccio as a JIRA ticket
It is easier to think of a carpaccio as a JIRA ticket. I have four types of JIRA tickets that individual contributors can work with. The first two, bugs and stories, represent carpaccio served. The other two, tasks and support tickets, represent work that is typically invisible, that team members perform but that does not end up in production.
- Bugs are one type of ticket that ends up in the customer's hands: be it an internal or external customer.
- Stories are new features, or any new code. If it's not a bug, it's a story.
- Tasks include writing documentation or debugging some complex code to understand its intent.
- But let’s look at the last one: support tickets or tier-three tickets as I like to call them. They are usually a big problem for all SaaS companies.
Almost every SaaS company has a support team whose members answer customer phone calls, emails, or who work with a chatbot. Many times, the support team needs engineering knowledge to answer customers’ questions.
In every organization I have worked with, this is a black hole. Generally, it isn't expected that engineers allocate time to answer questions from the support team, but the support team cannot help customers without these answers from engineering.
The carpaccio model fixes this by limiting the investigation to an hour. An engineer receives the request in the form of a question. They look at it for an hour and then have two possible outcomes. They find and deliver the answer, or they convert the request to a bug that needs to be prioritized. Our customer experience at LawnStarter changed completely to the positive because of this process.
Tying this back to this article and my previous carpaccio paper, the point is this: Bugs and stories end up in production, like carpaccio served. All other tasks or tier three tickets are typically invisible work – like sharpening knives and washing dishes in the carpaccio restaurant. That makes them part of the denominator in my formula.
The formula is this: stories, bugs, tasks, and support tickets are all placed in the denominator. In the numerator, just the stories and bugs.
I think we have something really special here because this can be literally an evolution beyond DORA 4 in how to measure team productivity. We finally recognize all the work that is needed to build software as valuable. It saves companies and jobs, and empowers companies to move more effectively in a substantially changed economy.
The emphasis must be on valuing all the work, not just the code delivered.
Let's dive back into our carpaccio restaurant scenario. Now suppose I need to have some work done on one of the ovens in our kitchen, where there is the potential for a gas leak. That’s an invisible component of the restaurant’s carpaccio presentation process. It's a security element – something our customers don't really care about. It’s a preventative measure, though. A restaurant needs to invest time in the work of maintaining its appliances. This costs the company time and money, and it is often hard to prioritize. But it still needs to be done.
Back in the software world, the same problems exist. Actions such as developing security patches or refactoring database queries to improve performance, for example, are typically seen as invisible pieces of work, often seemingly done spontaneously. But this is work that must be tracked because if you're going to be working on anything, you need to create a ticket for it. Whether you are running an investigation, creating documentation, changing some configuration in one of your servers in the production environment, or writing code, you must create a ticket.
So, here’s the key takeaway: all the work must have associated tickets, and each ticket should be seen as carpaccio-produced.
A ticket is work, and it has value. It belongs as part of the denominator of the Productivity Ratio. To distinguish this from the code, think of it like this: if it is work going to production, then it’s carpaccio served. If it's any other work that doesn't end up in production, it's carpaccio produced.
Expecting Utopia? Don’t.
Perfection is neither achievable nor is the effort expended sustainable. Placing 100% of the work produced by software teams in the hands of customers is not only a utopian ideal; it isn't even conducive to a satisfactory experience. In the same way, focusing 100% on invisible work such as writing documentation, developing developer tools, or improving CI/CD, will not allow us to have a sustainable business. At the end of the day, software teams need to deliver value, and that means finding a balance between delivering code and doing everything else. It is far wiser to pursue excellence than perfection.

Carpaccio productivity gauge
Based on my team's track record, the data shows that the sweet spot for excellence is anywhere between 75% and 85%. For anything less than that, I need my teams to focus on how to build the features that will keep the platform growing. But equally significantly, if we pass 85%, it means we are rushing too much, and are actually incurring too much strategic debt; we are preparing too many dishes and not doing enough cleaning and sharpening. This happens in software companies all the time.
In this case, when we go past 85%, I tell my teams to slow down, literally. We need to understand what we're doing. We need to invest more in writing documentation, automation, and infrastructure. We need to plan more in order to achieve the company's north star.
The Healthy Productivity Index
I know that counting everything that I serve is an inaccurate statement of my company’s success. I must also account for the defects (in a carpaccio restaurant this would mean improperly cut slices), and subtract them, rather than ignore them. I call this served minus defective.

Healthy productivity means focusing on delivery
A served minus defective number must incur a penalty. In my own formulas, I typically double the cost because the losses are greater than just one plate of carpaccio. For example, if a team is expected to deliver 300 carpaccios in a quarter, but 50% of those carpaccios are defective, the team is not only wasting food; they are also impacting the user experience. Those customers may not come back, and that’s a much bigger loss than simply having to replace a carpaccio dish. In addition, every time I must work on an interruption caused by a defect, not only is the customer who placed the order being impacted, but other customers, including those who did not order carpaccio, are being impacted, because I have limited capacity.
Therefore, the served minus defective number, divided by amount produced, all multiplied by a number that represents served divided by time, equals frequency. It's just the same as our software deployment frequency. This type of formula gives me an index for knowing how a particular software team is doing.
The healthy index functions as a unified measurement where I can oversee multiple teams, and I am able to know if they're delivering at their capacity with the expected quality. I can also find out how much each team costs and, therefore, the cost of each unit produced.
Conclusion: Teams Need Validation
The industry metrics currently used to measure the productivity of software teams are limited in their capacity and generally don't tell the whole story. They lack the ability to connect individual contributors to the company objectives (rocks). They are often obsessed with looking at “code produced,” when there is a lot more additional, other work that needs to be done.
Here are two simple success factors that I stand up for daily:
- Software engineers enjoy knowing that their work is being valued, even though the work might not be producing code itself.
- Engineers can follow where they stand in terms of tickets or carpaccio on a week-by-week basis, allowing them to self-correct or get guidance from their managers.
In other words, they know their individual goals and their team's goals and they are inspired to work hard to attain both. The concepts of Carpaccio Served and Carpaccio Produced bring visibility to the work of measuring the productivity of software teams. That’s why I'm so passionate about it: because it works.